
Top Trend Indicators For Improved Trading
Sometimes the difference between success and failure often lies in the mastery of trend analysis. The issue is that the trend direction is different in each time frame. Even when using trend indicators, it can be tough to determine trend direction until you determine the time frame you will be trading.
The top trend indicators in trading include candlestick charts, line charts, moving averages, trendlines, and channels. These tools assist traders in identifying market trends and making decisions based on price movements and patterns.
Use this table to determine your sweet spot for trading for trend identification.
| Trading Strategy | Timeframe | Description |
|---|---|---|
| Scalping | 1 minute – 15 minutes | Involves making numerous trades within a day, focusing on small price gaps caused by order flows or market imbalances. Traders hold positions for a very short time, aiming for quick gains. |
| Day Trading | 5 minutes – 1 hour | Traders enter and exit positions within the same trading day. This strategy avoids the risk of significant overnight movements. Timeframes are short but longer than scalping, allowing for analysis of more significant market trends. |
| Swing Trading | 1 hour – 1 day | Swing traders hold positions for several days or weeks, aiming to capture market momentum. They use slightly longer timeframes to identify and capitalize on more significant market movements. |
| Position Trading | 1 day – 1 week | This long-term strategy involves holding positions for weeks, months, or even years. Traders use longer timeframes to analyze broader market trends, ignoring short-term fluctuations. |
The next step is to determine what the trend direction is in the timeframe you have chosen. Once you have selected the time frame relevant to your trading style, stick to it. The only time I’d ever switch time frames is to go one step lower to find an early entry.
Price Action Analysis for Trading Success
Price action analysis provides insights into market structure, momentum, and sentiment. By analyzing the movement of prices on a chart without traditional indicators, traders can gain a better understanding of market movements.
The first step in price action analysis is to study the chart patterns and formations formed by price movements. This allows traders to identify key market levels, such as support and resistance. By observing trader behavior at these levels, traders can gain information about market sentiment – bullish, bearish, undecided.
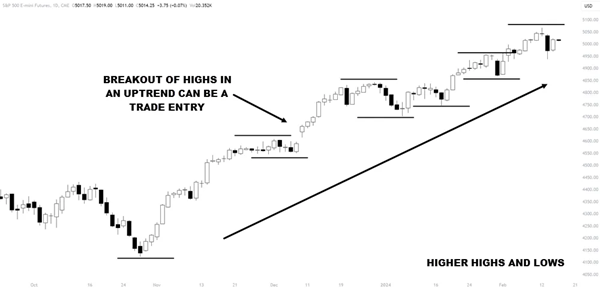
- An uptrend is a series of higher highs and higher lows
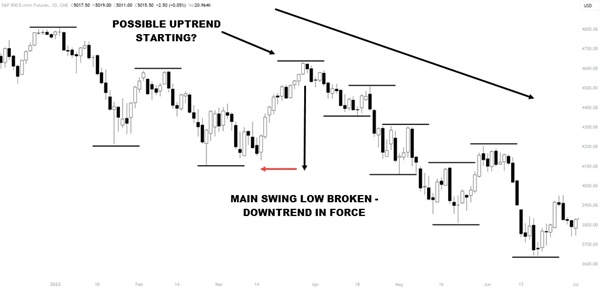
- A downtrend is a series of lower highs and lower lows
- A trading range (sideways) is a combination of both of those
In addition, price action analysis helps traders identify potential entry and exit points based on price patterns and market reactions. By focusing on the actual price movements, traders can gain a clear picture of the intentions of other participants and improve their trade selection.
Utilizing Candlestick Charts in Trend Analysis
Candlestick charts are a valuable tool for trend analysis as provide a visual representation of price movements. This allows traders to identify who is winning the bull-bear battle taking place on the charts.
Here are five key benefits of using candlestick charts in trend analysis:
- Clear visual representation: Candlestick charts offer a straightforward and concise visual representation of price movements. This makes it easier for traders to spot trends and patterns quickly.
- Revealing market sentiment: Different candlestick patterns, such as doji, engulfing, and hammer, provide information about market sentiment. By understanding the psychology of the market, traders can make better decisions.
- Indicating potential reversals: Candlestick patterns can act as early warning signs for potential trend reversals. By recognizing these patterns, traders can grab the opportunity to enter or exit positions at the right time, maximizing their profits and minimizing their losses.
- Confirmation of trend direction: Candlestick charts serve as a confirmation tool for trend direction. They complement other indicators and analysis techniques, providing traders with additional confidence in their trading decisions.
- Decision-making in volatile markets: In volatile markets, candlestick charts become even more useful. They help traders make decisions by visualizing price volatility and the strength of market moves.
Although candle charts are popular, they do have a lot of information you may not need.
Line Charts – Tracking The Close
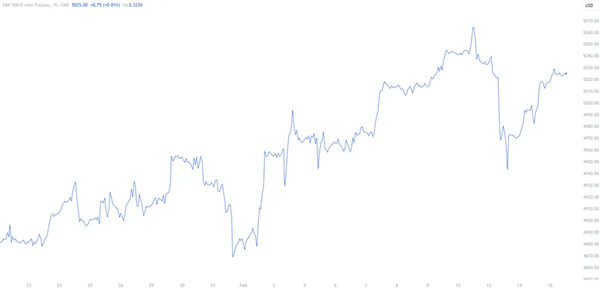
The beauty of a line chart lies in its ability to tell a story. Unlike more detailed charts that can overwhelm with information and colors, line charts focus on the essential – the closing price. This makes it simple to see if the closing price over time is trending higher or lower.
In the world of trading, where myriad indicators and complex chart types can confuse a trader, the line chart stands out for its simplicity and effectiveness. Its ability to present trend direction in an uncomplicated manner makes it an indispensable tool in every trader’s toolbox.
Power of Moving Averages in Trend Identification
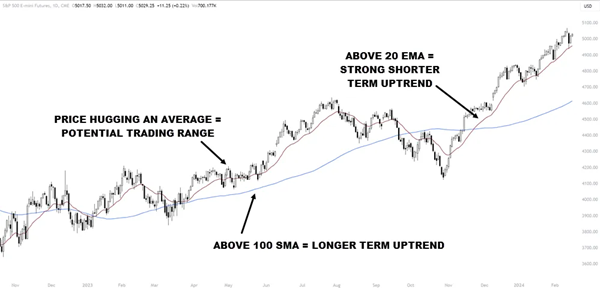
Moving averages are great tools for traders when it comes to identifying trends in the trading world. They provide a smooth and simplified view of price data, which helps determine the direction of a trend.
There are two main types of moving averages: simple moving averages (SMA) and exponential moving averages (EMA). Traders should pay close attention to crossovers of these moving averages, as they can indicate a potential change in trend. Make sure you see confirmation of the change through price movement.
Moving averages also serve as valuable indicators for identifying support and resistance levels, as well as evaluating the strength of a trend. The price that is extended from the average will often encounter mean reversion and we will see price pull back. When the price is near a moving average, look left on the chart for a price structure that may turn the price.
Trendlines and Channels for Accurate Trend Direction
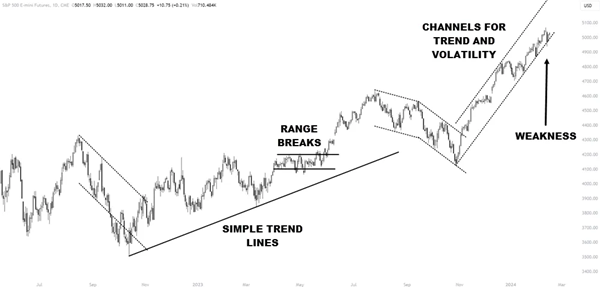
Trendlines and channels can be used to accurately identify and capitalize on market trends. These tools help in timing entries and exits, as well as visualizing trend continuation or reversal.
Here are five important points to keep in mind when using trendlines and channels:
- Trend Direction: Connect swing lows or highs to determine the direction of the trend. This helps in understanding whether the market is moving upwards or downwards.
- Channels: Channels are formed by drawing parallel lines that encompass price movements. They provide a visual representation of market behavior, allowing traders to see how prices move within a defined range.
- Breakouts: Pay attention to breakouts above or below trendlines. These breakouts can indicate the start of new trends, which can be valuable information when making trading decisions.
- Timing Entries and Exits: By observing trendline breakouts, traders can accurately time their entries and exits. This means entering a trade when the trendline is broken in the desired direction and exiting when the trendline is broken in the opposite direction.
- Support and Resistance: Trendlines and channels can also help identify support and resistance levels. These levels indicate price areas where the market is likely to encounter obstacles or reversals. Recognizing these levels enhances traders’ ability to determine the strength of a trend.
Summary
Choosing the right timeframe, combined with tools like price action analysis, candlestick charts, line charts, moving averages, trendlines, and channels, can significantly enhance trend analysis in trading. These methods provide a comprehensive view of market trends and potential opportunities, essential for making profitable trading decisions.
FAQ
What Defines the Most Effective Trading Indicator?
The most effective trading indicator is subjective and varies based on individual trading styles and market conditions. However, the Moving Average Convergence Divergence (MACD) is often regarded as highly successful due to its ability to reveal changes in the strength, direction, momentum, and duration of a trend in a stock’s price.
How to Identify the Prime Indicator for Trend Trading?
The best indicator for trend trading is typically the Moving Average (MA), especially the Exponential Moving Average (EMA). It’s effective because it helps traders identify the trend’s direction and smoothens out price data to create a single flowing line, making it easier to identify trends.
Which Leading Indicator Tops for Trading?
The Relative Strength Index (RSI) is widely considered the best leading indicator for trading. It measures the magnitude of recent price changes to evaluate overbought or oversold conditions in the price of a stock or other asset which can point towards potential trend reversals.
What Are the Most Essential Technical Analysis Indicators?
In technical analysis, the most essential indicators include the Moving Average (MA), Relative Strength Index (RSI), Bollinger Bands, Stochastic Oscillator, and Moving Average Convergence Divergence (MACD). These tools provide a wide range of insights into market trends, momentum, volatility, and strength.
What Are the Popular Stock Indicators?
The foremost stock indicators are the Moving Average (MA), Relative Strength Index (RSI), Bollinger Bands, Volume, and MACD. These indicators are highly valued for their ability to analyze market trends, price momentum, and trading volumes, which are crucial for stock trading.
Which Indicator is Preferred by Professional Traders?
Professional traders often prefer the Volume-Weighted Average Price (VWAP). VWAP gives an average price a security has traded at throughout the day, based on both volume and price. It is especially important for traders who need to gauge market direction and execute large orders.
What is the Big Move Indicator?
The Big Move Indicator, often referred to as the Average True Range (ATR), is a tool used to measure market volatility. It captures the degree of price movement or price swings, thereby helping traders predict significant moves in the market.
What are the Top 3 TradingView Indicators?
The top 3 TradingView indicators are typically the RSI, MACD, and Bollinger Bands. These tools are popular among users of the TradingView platform for their effectiveness in analyzing market trends, momentum, and potential price breakouts or reversals.
This post originally appeared at NetPicks.
Category: Technical Analysis


