
7 Essential Tips For Using Trend-Following Trading Indicators
To optimize your use of trend-following trading indicators, start by understanding how tools like moving averages and MACD work. Choose indicators that align with your trading strategy, making sure they are compatible with your market analysis goals.
Set clear, measurable objectives to guide your trading decisions and analyze the signals your indicators provide to maximize profit while minimizing risk. Combine multiple indicators to improve decision accuracy, avoiding overlap which can cloud judgment.
Main Points
- Select indicators that align with your specific trading goals and strategy.
- Combine multiple complementary indicators to improve decision accuracy.
- Regularly back-test indicators to confirm their effectiveness in varying market conditions.
- Set clear, measurable trading objectives to guide your use of indicators.
- Continuously analyze indicator signals to refine interpretations and improve trade decisions.
1. Understand the Basics First
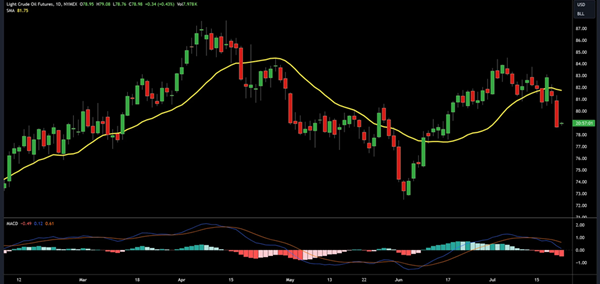
Before you start using trend-following indicators, understanding their fundamental, underlying principles and mechanics is an important aspect of trading. Trend-following indicators, like moving averages or the MACD, are designed to smoothen price data to create a followable trend line.
Understanding these tools involves more than just recognizing what they look like on a chart; you should explore how they calculate and interpret market data.
Practice patience and avoid shortcuts in this learning phase. Rushing into using these without a strong foundation often leads to misjudgments and financial losses. Instead, dedicate time to learning how these indicators respond to different market conditions. Analyze historical data and observe how trend indicators behave during volatile versus stable periods.
2. Choose the Right Indicators
Now that you understand the basics, choose indicators that align best with your trading strategy and market conditions. Indicator selection isn’t just about picking the most popular tool; it’s about finding what integrates with your trading style and the specific assets you’re trading.
This process is essential for your trading success, as the right indicators can improve your market analysis and enhance your decision-making process.
You’ll want to take into account indicator compatibility when optimizing your strategy. For instance, if your strategy is based on short-term movements, using indicators like moving averages with shorter periods may be more advantageous than those set for longer spans.
If you’re focused on long-term trends, a combination of a long-term moving average and a momentum indicator like the MACD (Moving Average Convergence Divergence) can offer more reliable signals.
Each indicator comes with its own set of data and responses to market changes. Analyze historical data to see how selected indicators behaved during different market conditions. This data-driven approach will allow you to assess the effectiveness of each indicator in line with your trading objectives and adjust accordingly, ensuring that your strategy remains strong and responsive to market dynamics.
3. Set Clear Trading Objectives
What are your specific goals for trading, and how do these align with the indicators you’ve chosen? To capitalize on trend-following indicators, you’ll need to define goals that line with the strategies these tools support.
Effective goal setting in trading forms the backbone of your trading strategy, guiding you through volatile markets with clear objectives.
| Goal Type | Description |
|---|---|
| Short-term Profit | Aim for quick gains from short-term price movements. |
| Long-term Growth | Focus on accumulating wealth over an extended period. |
| Risk Management | Minimize losses and manage the volatility of your portfolio. |
| Diversification | Spread investments across various assets to reduce risk. |
These goals should be precise and measurable. For instance, targeting a specific percentage return within a set timeframe or maintaining a maximum drawdown limit helps keep your strategy on track. You’ll find that aligning these objectives with suitable indicators—such as moving averages for trend identification or MACD for momentum—will optimize your trading decisions.
4. Analyze Indicator Signals
After setting your trading objectives, it’s important to understand how to interpret the signals from your chosen trend-following indicators. Interpreting signals accurately is key to maximizing profits and minimizing risks in your trading endeavors.
Each indicator provides unique data points and trends, and you need to analyze these carefully to make trading choices that fit the current market environment.
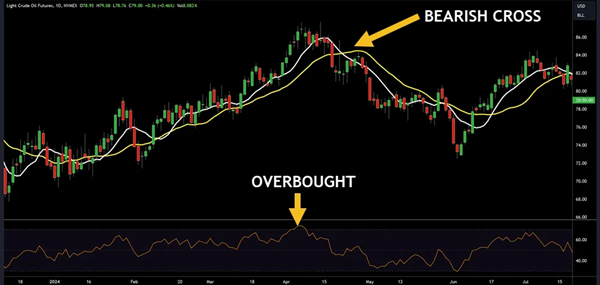
For instance, when using moving averages, a common indicator, watch for crossover events. A moving average crossover occurs when the shorter moving average crosses above or below the longer moving average. This is typically viewed as a potential buying or selling signal.
When the shorter average crosses above, it suggests an upward price momentum and might be a good time to buy. Conversely, a cross below might signal a selling point.
The Relative Strength Index (RSI) offers signals about overbought or oversold conditions. An RSI reading over 70 suggests an overbought market, potentially indicating a sell signal, whereas a reading under 30 might indicate an oversold market, suggesting a buy signal.
5. Combine Multiple Indicators
When you’re trading, it’s important to combine multiple indicators to improve decision accuracy.
You’ll want to select indicators that complement each other, ensuring they provide unique data points rather than merely echoing the same information.
This strategy helps in avoiding signal redundancy, optimizing your trading outcomes based on diverse, yet coherent, analytical inputs.
Selecting Complementary Indicators
Combining multiple trading indicators can enhance your strategy by providing diverse data points to confirm market trends. When you’re selecting complementary indicators, it’s essential to assess indicator compatibility and effectiveness, ensuring that the tools you choose harmonize rather than conflict.
Indicator compatibility involves selecting tools that offer insights from different perspectives without overlapping the data they analyze.
For example, pairing a momentum indicator like the Relative Strength Index (RSI) with a trend indicator like a Moving Average Convergence Divergence (MACD) can give you a fuller picture of the market conditions. The RSI measures the speed and change of price movements, while the MACD indicates the relationship between two moving averages of a security’s price.
| Indicator | Type | Complements | Rationale |
|---|---|---|---|
| Moving Average Convergence Divergence (MACD) | Trend and Momentum | RSI, Bollinger Bands | MACD identifies trend direction and strength, complementing momentum and volatility indicators |
| Relative Strength Index (RSI) | Momentum | MACD, Stochastic Oscillator | RSI measures speed and change of price movements, pairing well with trend and other momentum indicators |
| Bollinger Bands | Volatility | MACD, Volume | Bollinger Bands show price volatility, complementing trend and volume analysis |
| Stochastic Oscillator | Momentum | RSI, Moving Averages | Stochastic Oscillator identifies overbought/oversold conditions, working well with other momentum and trend indicators |
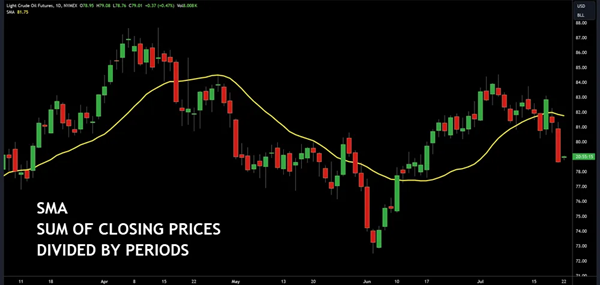
| Simple Moving Average (SMA) | Trend | MACD, Volume | SMAs show overall price trends, complementing momentum indicators and volume analysis |
| Volume | Volume | All of the above | Volume provides context for price movements, enhancing the effectiveness of all other indicators |
Indicator effectiveness is measured by how accurately the indicators predict market behavior. This requires back-testing each indicator under various market conditions to verify their reliability. You’ll want indicators that maintain a high level of precision in both volatile and stable markets.
Avoiding Signal Redundancy
To effectively utilize multiple trading indicators, it’s important to avoid signal redundancy by ensuring each tool provides unique, actionable insights. Combining indicators that simply repeat the same information doesn’t just waste your screen space; it also clutters your decision-making process, hindering your ability to act.
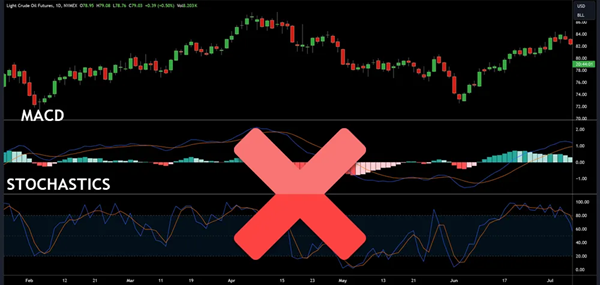
When you’re selecting tools, focus on those that complement each other instead of overlapping. This strategy is vital for eliminating noise and maximizing efficiency in your trading.
Here are some guidelines to help you achieve this:
- Diversify Indicator Types: Utilize one trend-following, one momentum, and one volume indicator to cover different aspects of market data.
- Interval Variations: Apply indicators over different time frames to get insights into both short-term fluctuations and longer-term trends.
- Threshold Settings: Adjust the settings of each indicator to minimize signal overlap, ensuring that each provides distinct information.
- Continuous Evaluation: Regularly review the effectiveness of your indicator combination to keep the setup optimized and responsive to changing market conditions.
6. Backtest Your Strategies
Before using any trend-following strategy, you must backtest it to assess its potential effectiveness. Backtesting allows you to simulate how your strategy would have fared based on historical data, providing a clear picture of its performance over various market conditions.
This process is critical not only to evaluate performance but also to refine strategies, verifying they are robust before live implementation.
Here’s a simple breakdown of what to look at when backtesting:
| Metric | Why It Matters |
|---|---|
| Profit Factor | Gauges overall profitability |
| Maximum Drawdown | Measures potential losses |
| Win Rate | Percentage of trades that are wins |
| Sharpe Ratio | Assesses risk-adjusted return |
Analyzing these metrics will help you understand the strengths and weaknesses of your trading strategy. For example, a high win rate might seem promising, but if your maximum drawdown is too large, the risk might not justify the returns.
A strategy with a lower win rate but a higher profit factor might be more sustainable long term.
Always make decisions based on the backtest results. If the Sharpe Ratio is low, consider ways to decrease volatility or improve the win rate. This data-driven approach guarantees that you’re not just following trends blindly but leveraging them strategically.
7. Stay Updated on Market Trends
After mastering backtesting, you’ll need to keep a close watch on market trends to ensure your strategies remain effective. Trend identification and market analysis are essential for adapting your trading approach in real time.
Using both historical data and current market signals, you can refine your forecasting techniques, ensuring they’re in line with the ongoing market dynamics.
Here’s how you can stay proactive in your market analysis:
- Continuous Learning: Engage regularly with financial news, reports, and expert analyses to grasp emerging trends.
- Utilize Technology: Employ advanced software tools that offer real-time data analysis and visualizations to spot changes in market conditions swiftly.
- Employ Diverse Techniques: Integrate various market analysis methods, including both quantitative approaches and qualitative assessments, to gain a comprehensive view of market trends.
- Routine Review: Establish a schedule to review and adjust your trading strategies based on the most recent data and trend forecasts to maintain relevance and effectiveness.
Frequently Asked Questions
What Is the Impact of Trading Volume on Indicator Accuracy?
Trading volume significantly impacts indicator precision. Higher volumes often improve indicator accuracy as they reflect more comprehensive market participation, making volume analysis essential for reliable readings in your trading strategy.
Can Trend-Following Strategies Work in a Low-Volatility Market?
Yes, trend-following strategies can work in low-volatility markets if you adjust your strategy to align with current market conditions, improve risk management, and diversify your portfolio to mitigate potential risks effectively.
How Often Should I Reevaluate My Indicator Settings?
You should reevaluate your indicator settings quarterly or in response to significant market shifts. Regular backtesting and timing adjustments guarantee ideal indicator customization, keeping your strategy aligned with prevailing market conditions.
What Are Common Psychological Traps in Trend-Following Trading?
Common psychological traps in trend-following include overconfidence and fear, which can disrupt emotional discipline and decision-making. It’s critical to stay data-driven and avoid letting emotions dictate your trading actions.
Conclusion
To effectively use trend-following indicators, you’ve got to understand their core principles and select those that align with your trading goals.
Analyze their signals meticulously and consider blending multiple indicators to mitigate risks.
Always backtest your strategies to confirm they hold up against historical data.
Staying on top of market trends is essential; it enables you to adapt and refine your approach, keeping it relevant and effective in a dynamic trading environment.
This post originally appeared at NetPicks.
Category: Technical Analysis


